From Reactive to Predictive: The Evolution of Observability
-

Ken Kasee is a 3x Telly Award-winning content marketer and digital marketing strategist with over 25 years of turning complex SaaS technology into clear, engaging stories.

It’s 6 a.m. on Monday. Your phone buzzes with a Slack notification. The CFO’s dashboard shows blank charts. The board presentation is in four hours.
Your team scrambles as someone uncovers a schema change in an upstream system that happened over the weekend. The pipeline feeding the executive dashboard fails silently. By the time everyone notices, the damage has already been done. Poor data quality can lead to operational issues, misguided strategies, and regulatory fines, exposing organizations to financial losses and reputational damage.
Sound familiar?
This scenario plays out daily in organizations. Data teams spend their time firefighting problems after damage has occurred, rather than building new capabilities. Data quality is the degree to which information meets standards for accuracy, validity, completeness, consistency, uniqueness, and timeliness.
In these reactive scenarios, inaccurate or inconsistent data leads to inefficiencies, delays, and increased costs. Poor quality data can cause organizations to lose an average of USD 12.9 million annually and damage brand reputation and customer satisfaction. Data quality problems stem from human error, system faults, and data corruption, increasing the risk of negative business outcomes. Data integrity is also at stake, as maintaining reliable information is critical for operations and decision-making.
Maintaining data quality is essential for trust and efficiency. High-quality data enables confident, informed choices and is vital for analytics, AI initiatives, and business intelligence.
But what if it didn’t have to be this way? What if that schema change triggered an alert hours before the dashboard refresh, giving your team time to fix the pipeline and prevent the CFO from seeing any issues?
That’s the promise of predictive observability. In 2026, it’s a reality.
The Reactive Trap
Traditional data monitoring relies on thresholds triggering alerts after issues occur — row counts drop, tables stop updating, null values spike. By then, erroneous data has spread downstream, corrupting dashboards and machine learning models.
Table 4.1: Typical Incident Timeline
Scroll for more
| Time | What Happens | The Problem |
|---|---|---|
| T+0 | A data quality issue occurs upstream | No detection yet |
| T+2 hours | Insufficient data propagates through pipelines | Damage spreading silently |
| T+4 hours | Downstream tables corrupted | Impact multiplying |
| T+6 hours | Business users notice wrong numbers | Trust already damaged |
| T+8 hours | Data team begins investigation | Playing catch-up |
| T+12 hours | Root cause identified | Half a day lost |
| T+24 hours | Issue resolved, data backfilled | Full day of insufficient data in production |
Data quality issues arise from system errors, human mistakes, or integration challenges. Robust data quality control processes—including automated validation, standardization, and continuous monitoring—are needed to ensure data accuracy, consistency, and integrity.
Research shows 74% of data quality issues are discovered by business users, not data teams. By then, it’s too late for prevention, only apologies. Data quality problems cause operational errors and inaccurate analytics. Privacy laws also require organizations to locate all personal data instantly, making data quality even more critical.
Dimensions of Data Quality: The Foundation of Effective Management
Understanding and measuring data quality requires analyzing it across multiple dimensions. Achieving true AI readiness, however, demands coverage across these five dimensions.
Table 4.2: The DataRadar™ Observability Framework
Scroll for more
| Dimension | What It Monitors | Why It Matters for AI |
|---|---|---|
| Data Reliability | Ensure accuracy, completeness, and consistency. Detect anomalies early. Deliver AI-ready data always. | Garbage in, garbage out—AI amplifies data issues |
| Pipeline Health | Track lineage, volume, freshness, and health. Know where data comes from and why it broke. | Broken pipelines = stale models = bad predictions |
| Performance Optimization | Monitor and optimize warehouse, query efficiency, and resource use. Prevent bottlenecks before they hit. | Bottlenecks delay model training and inference |
| Usage Intelligence | Gain visibility into utilization at the user, role, and department level, identify top consumers, and optimize. | Identifies high-value data and compliance risks |
| Cost Visibility | Track spend, spot inefficiencies, and get real-time alerts on cost spikes before they become problems. | AI workloads consume massive compute—costs kill projects |
These dimensions help categorize data quality metrics and guide efforts to improve data quality. Applying data quality rules based on these dimensions enables teams to effectively monitor and maintain high data quality.
Data Profiling and Analysis: The Foundation for Prediction
Predictive systems rely on quality data. Decisions based on outdated or incomplete information lead to costly mistakes. For insurance companies like Freeway Insurance, accurate data is essential for customer coverage and compliance.
Data profiling involves examining data sources to spot patterns and problems early. It helps assess data quality and identify what needs improvement.
A strong data quality assessment framework uses key data quality dimensions—accuracy, completeness, consistency, and timeliness—to ensure data meets standards. Data quality metrics and rules help monitor and maintain these standards.
Data governance practices set clear rules and accountability. Data stewards and data scientists oversee data quality, catching issues like messy formatting, missing values, or duplicates before they affect analytics.
Master data management creates a single trusted source, preventing inconsistent data formats and duplicate records across departments. This is crucial in insurance, where errors can lead to claim denials, regulatory issues, or dissatisfied customers.
Data quality management tools automate profiling, cleaning, validating, and monitoring. Dashboards provide real-time insights so teams can act confidently.
As data volumes grow, maintaining quality becomes complex. Continuous investment, regular assessments, and a culture valuing data quality are essential.
High data quality is the foundation for predictive analytics and observability. Without reliable data, even advanced systems fail. Prioritizing data quality helps companies like Freeway Insurance prevent problems, keep customers satisfied, and improve outcomes.
How Predictive Observability Actually Works
Predictive observability uses machine learning to learn what “normal” looks like across multiple dimensions:
-
Volume patterns and seasonality: Typical data arrival patterns by time and date.
-
Freshness expectations: How often data updates and acceptable latency.
-
Schema stability: Expected data structure and column changes.
-
Distribution characteristics: Typical ranges and cardinalities of data fields.
-
Lineage dependencies: Upstream changes affecting downstream assets.
When data deviates from learned patterns, alerts fire before downstream impact, providing 15-30 minutes lead time for intervention.
The Monday Morning Scenario, Reimagined
Let’s replay that CFO dashboard incident with predictive observability in place.
-
Friday, 11 p.m.: An upstream system deploys a schema change. A column your pipeline depends on is renamed.
-
Friday, 11:05 p.m.: The predictive observability system detects a schema change and traces lineage to identify all downstream dependencies, including the executive dashboard.
-
Friday, 11:06 p.m.: Alert fires to the on-call engineer with full context: what changed, what’s affected, and suggested remediation.
-
Friday, 11:30 p.m.: The engineer updates the pipeline to support the new schema. Tests pass. Pipeline runs successfully.
-
Monday, 6 a.m.: The CFO opens the dashboard. Charts load correctly, and the board presentation proceeds as planned. Nobody knows there was ever an issue.
-
The difference isn’t just speed; it’s impact. Reactive monitoring measures mean time to resolution (MTTR). Predictive observability measures incidents prevented. One metric tracks how fast you clean up messes. The other tracks mess that never happened.
The Numbers Behind the Shift
Organizations with real-time observability resolve incidents 40% faster than those relying on reactive approaches.² However, that statistic, while impressive, understates the true value.
Faster resolution still means incidents happen. The true value of predictive observability lies in preventing incidents from occurring by identifying and fixing issues early.
Table 4.3: Consider the Economics Behind the Shift
Scroll for more
| Metric | Reactive Approach | Predictive Approach |
|---|---|---|
| Average incidents/month | 67 (industry average) | Significantly reduced through prevention |
| MTTD (Mean Time to Detect) | Hours to days | Minutes |
| MTTR (Mean Time to Resolve) | Hours | 40% faster |
| Business user discoveries | 74% of issues | Near zero |
| Trust impact | Cumulative erosion | Maintained/improved |
Organizations that use predictive observability experience fewer incidents and maintain greater trust in their data.
Promoting data quality throughout the organization decreases incidents and enables better decision-making. Data quality standards help ensure the success of data-driven strategies.
Ongoing data cleansing corrects errors, removes duplicates, and enhances accuracy. Data quality management is a key part of data governance, with tools often utilizing AI and machine learning to automate tasks. Data quality initiatives involve collaboration among business users, data scientists, and analysts.
Understanding the difference between data quality and data integrity is vital: data quality focuses on accuracy and usefulness, whereas data integrity ensures security and consistency throughout the data’s lifecycle. Both aspects are essential for efficient data management.
Emerging Data Quality Challenges
As organizations face growing data volumes and complexity, emerging data quality challenges arise:
-
Managing enterprise data across multiple platforms and cloud environments.
-
Ensuring consistent data formats and data relationships in hybrid and multi-cloud architectures.
-
Addressing data quality issues in real-time data streams and supply chain data.
-
Complying with evolving data governance practices and privacy regulations.
-
Balancing data validation rules with operational efficiency.
-
Integrating data quality management tools that leverage AI for anomaly detection and remediation.
Effective data quality management requires continuous monitoring, regular assessments, and adapting to new challenges to maintain trusted data.
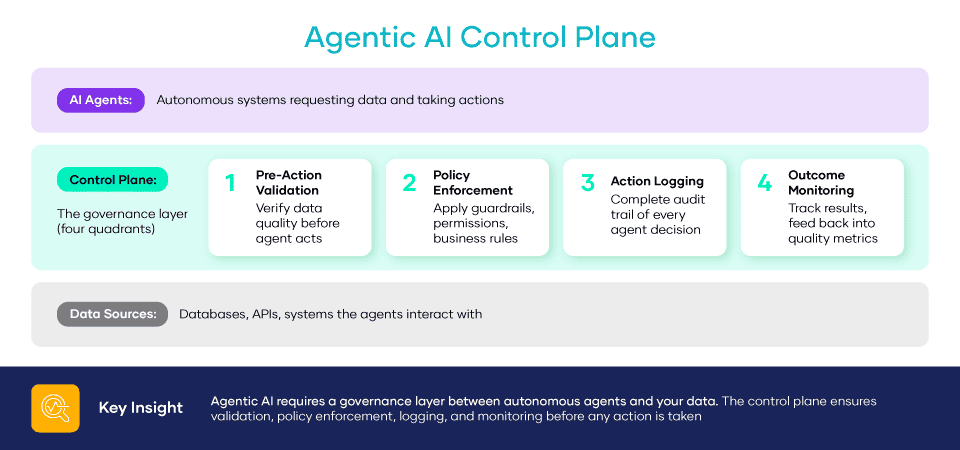
How Predictive Observability Connects to Three Other Trends
Predictive observability doesn’t exist in isolation. It’s the foundation for several other 2026 trends:
- Agentic AI Governance (Trend 4): When AI systems take autonomous actions, you can’t afford reactive detection. Predictive observability provides the real-time quality gates that agentic AI needs.
- Real-Time Quality Monitoring (Trend 7): Shift-left validation at ingestion relies on ML-powered anomaly detection. Predictive observability enables real-time quality checks.
- Observability as Business Value (Trend 5): Prevention is easier to quantify than cure. When you can say ‘we prevented 50 incidents this quarter,’ the business case writes itself.
Key Takeaways
- Reactive monitoring is a trap. By the time threshold-based alerts fire, damage has already spread. You’re always playing catch-up.
- Predictive observability learns what’s normal. ML algorithms establish baselines across volume, freshness, schema, distribution, and lineage, then alert on deviations.
- 15-30-minute lead time changes everything. Early warning gives teams time to prevent impact rather than to contain damage.
- Prevention beats resolution. A 40% faster MTTR is good. Incidents that never happen are better.
- This enables other trends. Agentic AI, real-time quality, and business value all depend on predictive capabilities.

Sources
¹ Precisely & Drexel University LeBow College of Business. (2024, September). 2025 outlook: Data integrity trends and insights. https://www.precisely.com/resource-center/ebooks/2025-outlook-data-integrity-trends-and-insights
² Confluent & Freeform Dynamics. (2024, June). 2024 data streaming report: Breaking down the barriers to business agility and innovation. https://www.confluent.io/resources/report/2024-data-streaming-report/