The Real ROI of Data Observability: A Four-Dimension Framework
-

Ken Kasee is a 3x Telly Award-winning content marketer and digital marketing strategist with over 25 years of turning complex SaaS technology into clear, engaging stories.
The CFO leans forward in the quarterly budget review. “This data observability line item. Walk me through the ROI.”
The data leader pauses. They know the platform has prevented countless incidents. They know the team spends less time firefighting. They know the dashboards are more reliable than ever. But translate that into dollars and cents? That part is harder.
“It’s infrastructure,” they finally say. “It’s like asking for the ROI on electricity.”
The CFO isn’t satisfied. And honestly, neither should the data leader be.
For too long, data observability has been positioned as technical overhead. A necessary cost of doing business, like insurance or security. But the organizations leading in 2026 have figured out something different. Data observability isn’t a cost center. It’s a value driver. And they can prove it.
The Measurement Problem
Why is observability ROI so hard to articulate? The primary value comes from things that don’t happen.
Consider what good observability actually delivers:
Incidents prevented. The schema change that would have broken the CFO dashboard was caught at 11 p.m. rather than at 6 a.m. But how do you count incidents that never occurred?
Trust preserved. Business users continue relying on dashboards without maintaining shadow spreadsheets. But how do you measure trust that wasn’t eroded?
Time reclaimed. Engineers spend mornings building features instead of debugging pipelines. But they weren’t tracking “hours spent firefighting” before.
Decisions improved. The pricing model uses accurate data instead of flawed inputs. But nobody knows what decision they would have made with bad data.
Traditional ROI frameworks struggle with prevention. They’re built to measure gains, not losses avoided. This leaves data teams defenseless in budget conversations. They show up with anecdotes when executives want numbers.
The market makes this harder. Quality-focused vendors prove value in incidents resolved. Cost-focused vendors prove value in credits saved. Neither framework captures the full business impact. And neither speaks the language executives actually use.
A Framework That Works
Leading organizations have developed a four-dimension framework for articulating observability value in terms executives understand.
1. Revenue Protection
Start with a simple question. What revenue depends on accurate, timely data?
For an e-commerce company, that might include:
- Product recommendations driving 15% of purchases
- Dynamic pricing affecting margins by 3 to 5%
- Inventory forecasting preventing stockouts and overstock
Now quantify exposure. If recommendation quality degraded undetected for one week, what’s the revenue impact? If pricing data lagged by 24 hours during a promotional period, what margin would be lost? These are calculable numbers. They make the case for observability investment concrete.
The goal isn’t perfect precision. It’s establishing a defensible range that gets attention. A finance team can argue with $4.2M. They can’t argue with “a lot.”
2. Operational Efficiency
How much time does your team spend on reactive firefighting versus proactive improvement?
Research shows the average organization experiences 67 data incidents per month.¹ Each incident requires investigation, root cause analysis, remediation, and stakeholder communication. Conservative estimate: 4 to 8 hours per incident. That works out to 268 to 536 hours monthly. Or 1.5 to 3 full-time engineers doing nothing but cleanup.
With modern observability, organizations report 50%+ reduction in incident volume and 40% faster resolution times.² Translate that to engineer hours saved, and the numbers get attention in budget meetings. A senior data engineer at fully loaded cost runs $200K or more annually. Recovering even 1.5 engineer-equivalents represents $300K in capacity returned to strategic work.
That’s not just cost avoidance. That’s capacity creation.
3. Risk Mitigation
What’s the regulatory, reputational, and operational risk exposure from data quality failures?
Consider the regulatory landscape:
- GDPR fines up to €20M or 4% of global revenue
- DORA requirements now in effect for European financial services
- EU AI Act mandates for high-risk AI systems
- SOX requirements for public company financial data
- HIPAA penalties for protected health information
Reputational damage compounds the financial exposure. Customer trust erodes when AI systems give wrong answers. Recommendations fail. Pricing errors hit social media. Recovery takes years.
Operational risk closes the loop. Decisions made on faulty data lead to bad outcomes. Bad outcomes lead to lost customers, regulatory scrutiny, and shareholder questions.
Risk mitigation value is often the largest component of the ROI case. But it’s expressed in penalties avoided and exposure reduced, not revenue generated. That requires reframing the conversation away from traditional ROI math.
4. Innovation Enablement
What becomes possible when data is trustworthy?
This is the opportunity cost dimension, and it’s the one most teams underestimate. Organizations with unreliable data can’t deploy AI at scale. Research shows 88% of AI pilots fail, primarily due to data quality issues.³ They can’t enable self-service analytics because users don’t trust the data. They can’t make real-time decisions because the data might be wrong.
Trustworthy data unlocks capabilities that were previously impossible. A single AI initiative reaching production might justify the entire observability investment. Three or four reaching production transforms the budget conversation entirely.
That’s value creation. Not just value protection.
Scroll for more
| Requeriment | Key Questions | Example Metrics |
|---|---|---|
| Revenue Protection | What revenue depends on data accuracy? | Revenue at risk, margin exposure, conversion impact |
| Operational Efficiency | How much time spent on firefighting? | Engineer hours saved, incidents prevented, MTTR reduction |
| Risk Mitigation | What’s the compliance/reputation exposure? | Penalties avoided, audit findings, SLA compliance |
| Innovation Enablement | What becomes possible with trusted data? | AI initiatives enabled, self-service adoption, time to insight |
Making It Concrete
Apply this framework to a realistic scenario. A mid-size enterprise with:
- $500M annual revenue
- 10 data engineers
- $2M annual cloud data spend
- 3 AI initiatives in development
Revenue Protection. 20% of revenue touches data-driven systems. Even 0.5% protection equals $500K.
Operational Efficiency. Reducing firefighting by 50% frees 1.5 engineer-equivalents. That’s $225K in loaded cost.
Risk Mitigation. Avoiding one significant compliance finding ranges from $100K to $1M depending on severity.
Innovation Enablement. Enabling even one AI initiative to reach production drives $500K+ in annual value.
Total quantifiable value: $1.3M+ annually. Against typical observability platform costs of $100K to $300K, the ROI math becomes compelling. Five to ten times return on investment is realistic when teams quantify all four dimensions.
Why Most Teams Get This Wrong
Three patterns explain why data leaders struggle with observability ROI conversations.
First, they pick one dimension and stop. Operational efficiency is the easiest to measure, so it dominates the conversation. But operational efficiency alone rarely justifies the investment. The full case requires all four dimensions working together.
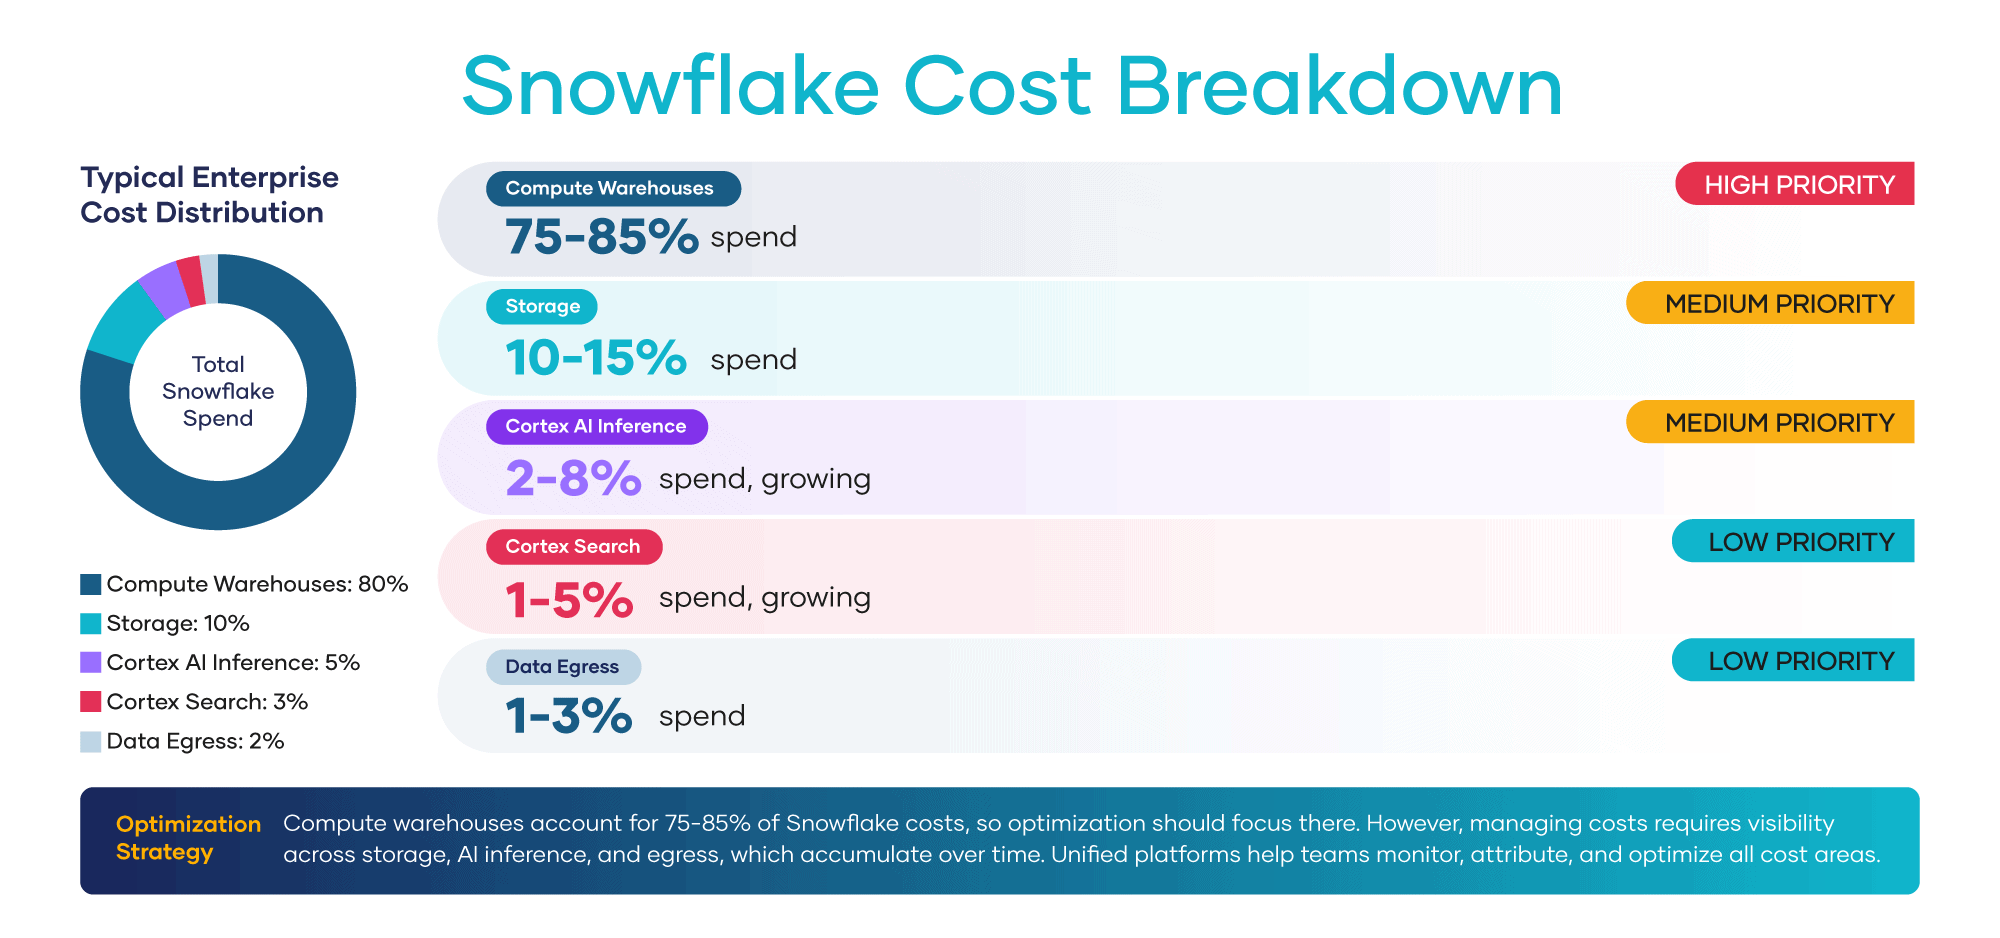
Second, they confuse cost reduction with cost optimization. Cutting expensive queries without understanding their business value isn’t optimization. It’s risk creation. Real optimization requires visibility into both spend and impact, which means quality and cost monitoring need to work as one system. Outside tools that handle one without the other create blind spots, not savings.
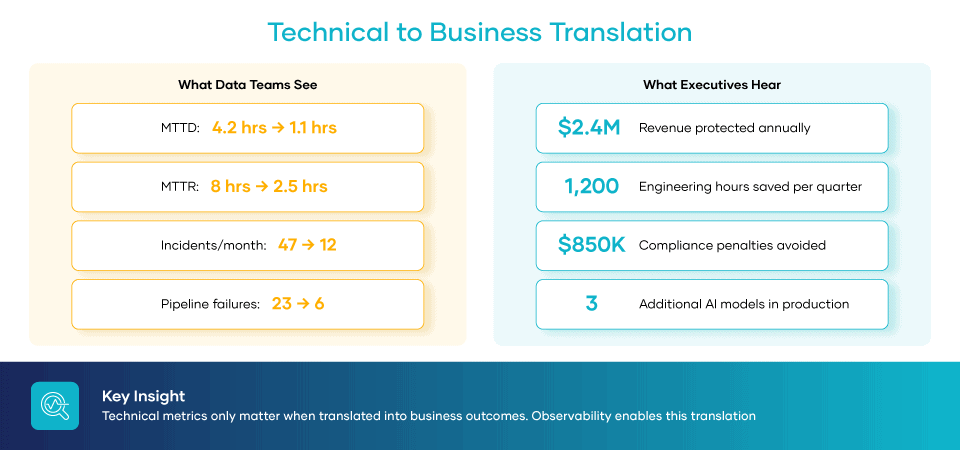
Third, they speak in technical terms when executives want business outcomes. “MTTD reduced by 40%” doesn’t move budget. “Problems caught before customers notice” does.
The fix is the same in each case. Lead with the executive question. Translate metrics into outcomes. And recognize that quality and cost aren’t separate disciplines. They’re two views of the same reality.
Key Takeaways
-
Prevention value is hard to measure but real.The challenge is quantifying incidents that never happened and trust that wasn’t eroded.
-
Four dimensions capture the full picture. Revenue protection, operational efficiency, risk mitigation, and innovation enablement each speak to different executive concerns.
-
Start with questions, not metrics. “What revenue depends on data accuracy?” opens more productive conversations than “How many alerts did we fire?”
-
The ROI math works. When you quantify across all four dimensions, observability investments typically show four to ten times returns.
-
Language matters. Translate technical metrics into business outcomes. “MTTD reduced by 40%” becomes “Problems caught before customers notice.”


Sources
¹Monte Carlo & Wakefield Research. (2023). Data downtime nearly doubled year over year, Monte Carlo survey says. Monte Carlo. https://www.montecarlodata.com/blog-data-quality-survey
²Nash, K. S. (2025, March 25). 88% of AI pilots fail to reach production, but that’s not all on IT. CIO. https://www.cio.com/article/3850763/88-of-ai-pilots-fail-to-reach-production-but-thats-not-all-on-it.html
3New Relic. (2024). 2024 observability forecast. New Relic. https://newrelic.com/resources/report/observability-forecast/2024