

Data Observability Split in Two. Neither Half Is Enough.
-

- 28+ years of enterprise technology leadership and digital transformation.
- Specializes in Snowflake, AI automation, and large-scale system integrations
Chris helps organizations modernize operations, improve security and compliance, and unlock business value through strategic technology initiatives.

The data observability market promised enterprises a single answer to a complex problem. Instead, it delivered two partial solutions, sold separately, each solving half the problem, neither designed to work with the other. That is the story of how we got here and why the architecture beneath your observability platform matters more than the features on top of it.
How the Data Observability Market Evolved Into Two Camps
The monitoring category emerged after 2020, when cloud data platforms, mainly Snowflake, made it possible to centralize enterprise data at a scale that was previously impractical.1
With that scale came a new class of problems. Data pipelines broke in ways that were hard to detect. Tables went stale without anyone noticing. Schema changes cascaded downstream. Business stakeholders started catching data quality issues before data teams did, which is a reliable signal that something in the monitoring architecture is not working.
A generation of data observability startups emerged to solve these problems. They built machine learning models to detect anomalies in freshness, volume, schema drift, and distribution. They mapped lineage so data teams could trace a broken report back to its source. And they did it well. Companies like Monte Carlo, Anomalo, Bigeye, and others built real products that delivered real value for data quality use cases.
But a second problem was developing in parallel: the quality-focused tools were not built to address cost.
Snowflake’s consumption-based pricing model is elegant in its simplicity yet difficult to manage at scale. As warehouses grew, compute costs grew with them, often outpacing the business value they generated. Query sprawl, inefficient pipelines, wasted credit allocation, and shadow compute workloads began meaningfully increasing cloud budgets. A separate category of tools emerged to address this: cost optimization platforms focused on query performance, credit management, and warehouse efficiency.
Keebo and Select.dev are examples of platforms built for Snowflake cost optimization. They are well-designed tools for a specific problem. But they are cost tools, not monitoring tools. 2,3
Key Insight:
Enterprises running Snowflake ended up with two categories of tools, each partially solving the problem, neither providing a unified view of what is actually happening in their data environment.
What is the Bifurcation Problem?
Data quality tools can tell you that something is wrong with your data. Cost tools can tell you that something is expensive. Neither can tell you, from a single interface, that a specific pipeline anomaly is causing both a data quality failure and a compute cost spike. That needs a unified platform.
What are Enterprises Really Buying for Observability and at What Cost?
When an enterprise buys a data quality tool and a cost optimization tool separately, they are not just paying two licensing fees. They are paying for two connection layers, two monitoring configurations, two alert systems, two dashboards, and two support relationships.
They are also accepting two separate security surfaces. Both tools require outside connection to the customer’s Snowflake environment. Both require access tokens or credentials to access data. Both establish trust relationships between the enterprise and an outside platform.
The events of Good Friday/Passover 2026 illustrated what happens when one of those trust relationships is exploited. As reported, a breach at Anodot, a third-party analytics platform integrated with Snowflake, resulted in access tokens being stolen and used to access more than a dozen enterprise Snowflake accounts. Snowflake’s own platform was not compromised. The platform held. The integration layer did not.4
This is not a hypothetical risk. It is a demonstrated attack pattern that has now occurred twice in 18 months against Snowflake-connected enterprise environments.
Verizon’s 2025 Data Breach Investigations Report found that supply chain breaches averaged $4.46 million per incident and took an average of 26 extra days to detect compared to other breach types.5
Layer on top of that the cost of wasted Snowflake compute, the overhead of maintaining two external tool connections, and the potential exposure of a third-party breach, and the true cost of a split monitoring setup becomes substantial. IBM’s 2025 Institute for Business Value research found that more than a quarter of organizations lose over $5 million annually from data quality issues alone.6
Why is Nobody Talking About Observability Architecture?
When enterprise data teams evaluate monitoring tools, the talk usually centers on features: which monitors are available, how good the anomaly detection is, what the lineage visualization looks like, and whether the alerting integrates with Slack or Teams.
These are reasonable questions. But they are the wrong first question.
The right first question is: where does this tool live relative to my Snowflake environment, and what happens to my data when it operates?
There are fundamentally two architectural models for Snowflake data observability:
Model 1: External SaaS Integration
The tool lives outside Snowflake. It connects via API, using access tokens or credentials stored on an external server. Data is extracted, transmitted, and processed outside your Snowflake environment. Your governance trail splits at the boundary. Your audit logs stop at the edge of your Snowflake perimeter. Your backup plan has a gap wherever the external platform’s uptime does not match Snowflake’s.
Most of the existing players in the data observability market were built on this model. It was the right architecture for its time, when Snowflake’s Native App Framework did not exist. It is harder to justify now that it does.
Model 2: Snowflake Native App
The tool lives inside Snowflake. It is built on the Snowflake Native App Framework, which means it runs fully within the customer’s account, on the customer’s compute, and against live data. No external cloud systems are required. No access tokens are sent to third-party servers. By design, no data leaves the customer’s Snowflake environment.7
The performance difference is significant. Native compute queries run against live data. There is no extract, no sync job, no cache. When a pipeline health monitor fires an alert, it is reacting to what is happening in your data right now, not six hours ago.
The governance difference is complete. Every query, every action, every access event is logged within Snowflake’s own audit framework. There is no external system holding a parallel copy of your governance trail. Compliance questions have a single clear answer.
The security difference is structural. A Native App that runs inside Snowflake has no outside connection to exploit. The attack vector that was used in the April 4, 2026, breach, compromising a third-party integration platform and stealing its access tokens, is materially reduced in a true native deployment.
Key Insight:
A true Snowflake Native App is not a SaaS product with a Snowflake connector. It is an application that runs within Snowflake’s own infrastructure, governed by Snowflake’s own security model, with no reliance on external cloud platforms. Snowflake’s own documentation defines this clearly.
The Dimensional Framework the Market Has Not Unified
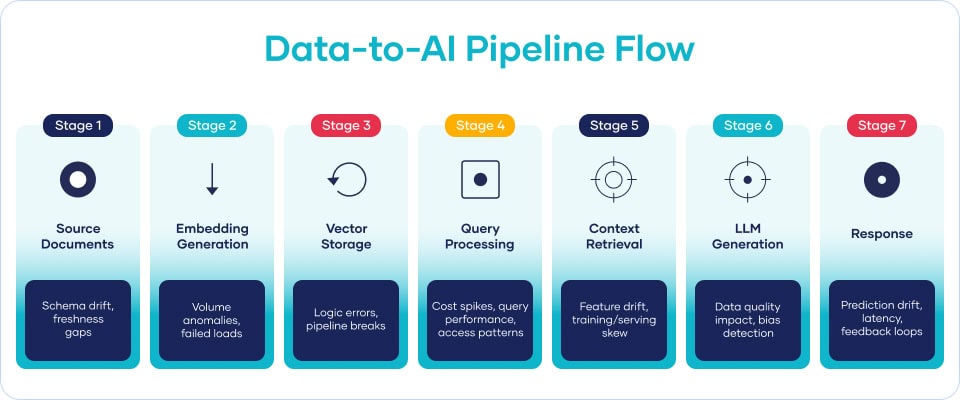
When I look at the data observability landscape from an engineering and product standpoint, I see five distinct problem dimensions that every enterprise running Snowflake at scale needs to address:
- Data Reliability: Is the data accurate, complete, and consistent? Are there anomalies in values, volumes, or freshness that indicate a quality problem upstream?
- Pipeline Health: Are the pipelines that move data into and through Snowflake operating correctly? Are jobs completing on schedule? Are there failures or latency spikes that will cascade into downstream problems?
- Performance Optimization: Are queries running efficiently? Are there expensive operations that could be rewritten or scheduled differently? Is compute being allocated to workloads that justify the cost?
- Usage Intelligence: Who is accessing what data, and how often? Are there patterns in access that indicate misuse, shadow workloads, or governance gaps? Is there data nobody is using that is still consuming storage and compute?
- Cost Visibility: Where is Snowflake credit being consumed? Which teams, pipelines, and queries are driving the highest cost? What can be optimized without sacrificing performance?
The existing market has split across these dimensions. Quality tools tend to cover Data Reliability and, to varying degrees, Pipeline Health. Cost tools tend to cover Performance Optimization and Cost Visibility. Usage Intelligence falls between the two categories.
The result is that enterprises with advanced Snowflake deployments end up with partial coverage across five deeply interconnected dimensions. A pipeline health failure that creates an anomalous data quality result often also creates an unusual cost spike and an abnormal usage pattern. To understand the full picture, you need to see all five dimensions in the same view, at the same time, against the same live data.
That is what a single native platform makes possible. DataRadar™ covers all five dimensions natively within a single Native App, with no external dependencies or integration gaps.
The Consolidation Argument
Enterprises are under real pressure to consolidate their data tool stacks. The growth of best-of-breed SaaS tools over the past five years created capability gains but also added complexity, budget split, and security surface expansion.
The monitoring category is a microcosm of this broader trend. Buying a quality tool and a cost tool apart made sense when no single platform covered both. That is no longer the case.
The total cost of ownership argument for consolidation is straightforward: one licensing relationship versus two, one connection surface versus two, one security review versus two, one support escalation path versus two, and one unified dashboard versus a context switch every time you need to connect a data quality alert to a cost anomaly.
The performance argument is equally clear: a native platform that queries live data directly is faster, more accurate, and more current than any architecture that depends on data extraction and synchronization to an external system.
The security argument, as Good Friday 2026 demonstrated, is no longer theoretical.
The data observability market grew to an estimated $2.37 billion in 2024 and is projected to reach $4.73 billion by 2030.8
A meaningful portion of that growth will come from enterprises consolidating split tool stacks onto single native platforms. The market bifurcation that created the two-camp problem is beginning to resolve, and it will resolve toward architecture, not features.
What Should You Look for in a Unified Native Platform?
If you are evaluating data monitoring platforms right now, these are the questions that will separate a genuine native platform from a SaaS product with a native-sounding name:
- Does the platform run fully within my Snowflake account, or does it establish connectivity to an external cloud?
- Are access tokens or credentials sent to third-party servers at any point in the operation?
- Does the platform cover data quality, pipeline health, performance, usage intelligence, and cost visibility in a single interface?
- Can I verify the native deployment model in Snowflake’s own marketplace and Native App Framework docs?
- What happens to my observability when the vendor has an outage? If the answer is ‘your monitoring goes down,’ that is a dependency risk worth understanding.
These questions are not designed to favor any particular vendor. They are designed to surface design realities that feature comparisons and marketing materials rarely make explicit.
Summary Takeaway
The data observability market is split into two camps: data quality tools and cost optimization tools. Enterprises bought both and still had gaps. The Native App model changes the equation by unifying five observability dimensions inside Snowflake, eliminating the external integration layer, and closing the security surface that fragmented tool architectures create. Architecture is the conversation the market has been avoiding. It is time to have it.
Explore DataRadar
Download the 2026 Enterprise Playbook:
See DataRadar in action:
Try it free for 30 days:
Frequently Asked Questions
Why did the data observability market split into two camps?
The market evolved around two distinct but related problems: data quality and compute cost. Different startups built tools optimized for each problem. The result was a fragmented landscape in which enterprises needed to buy two separate products to address the full scope of observability. Neither camp was designed with integration in mind, leaving visibility gaps where the two problem domains overlap.¹
What is a Snowflake Native App and how is it different from a SaaS integration?
A Snowflake Native App is built on Snowflake’s Native App Framework and runs entirely within the customer’s Snowflake account. Data never leaves the environment. There are no external cloud dependencies, no access tokens sent to third‑party servers, and no connection to an external platform. By contrast, a SaaS integration connects to an external vendor cloud via API and credentials, creating a trust dependency outside the customer’s security edge.⁷
How does the Native App model improve data observability and security?
A true Snowflake Native App eliminates the external connection layer that has served as the entry point in recent enterprise data breaches. When a tool runs fully within Snowflake, there are no access tokens held by third‑party platforms, no external connection to exploit, and no trust relationship outside the customer’s security edge. As reported, the attack vector used in the April 2026 Anodot breach materially reduces in a native deployment.⁴
How can I evaluate whether a data observability tool is truly native?
Verify the deployment architecture in Snowflake’s Marketplace and Native App Framework documentation. Ask the vendor exactly whether their platform establishes connectivity to external cloud systems during normal operation and whether access tokens are transmitted to or stored on their servers. A truly native platform will provide clear, verifiable answers to both questions. DataRadar’s native deployment can be independently verified in the Snowflake Marketplace.⁷
References
¹ (2026, January 31). The hidden cost of poor data quality governance: ADM turns risk into revenue. Acceldata Blog. https://www.acceldata.io/blog/the-hidden-cost-of-poor-data-quality-governance-adm-turns-risk-into-revenue
² Keebo. (2025). Autonomous Snowflake cost optimization. Keebo. https://keebo.ai
³ Select.dev. (2025). Snowflake cost optimization platform. Select.dev. https://select.dev
⁴ Abrams, L. (2026, April 9). Snowflake customers hit in data theft attacks after SaaS integrator breach. BleepingComputer. https://www.bleepingcomputer.com/news/security/snowflake-customers-hit-in-data-theft-attacks-after-saas-integrator-breach/
⁵ Verizon. (2025). Data Breach Investigations Report 2025. Verizon. https://www.verizon.com/business/resources/reports/dbir/
⁶ IBM Institute for Business Value. (2025, November 12). The 2025 CDO study: The AI multiplier effect. IBM. https://www.ibm.com/think/insights/cost-of-poor-data-quality
⁷ Snowflake. (2024). About the Snowflake Native App Framework. Snowflake Documentation. https://docs.snowflake.com/en/developer-guide/native-apps/native-apps-about
⁸ Grand View Research. (2024). Data observability market size, share and trends analysis report. Cited in: Integrate.io. (2026, January 12). Data quality improvement stats from ETL. https://www.integrate.io/blog/data-quality-improvement-stats-from-etl/

